Slide 15 · Layer 4: Observability and Monitoring
You cannot secure what you cannot see. You cannot fix what you cannot explain.
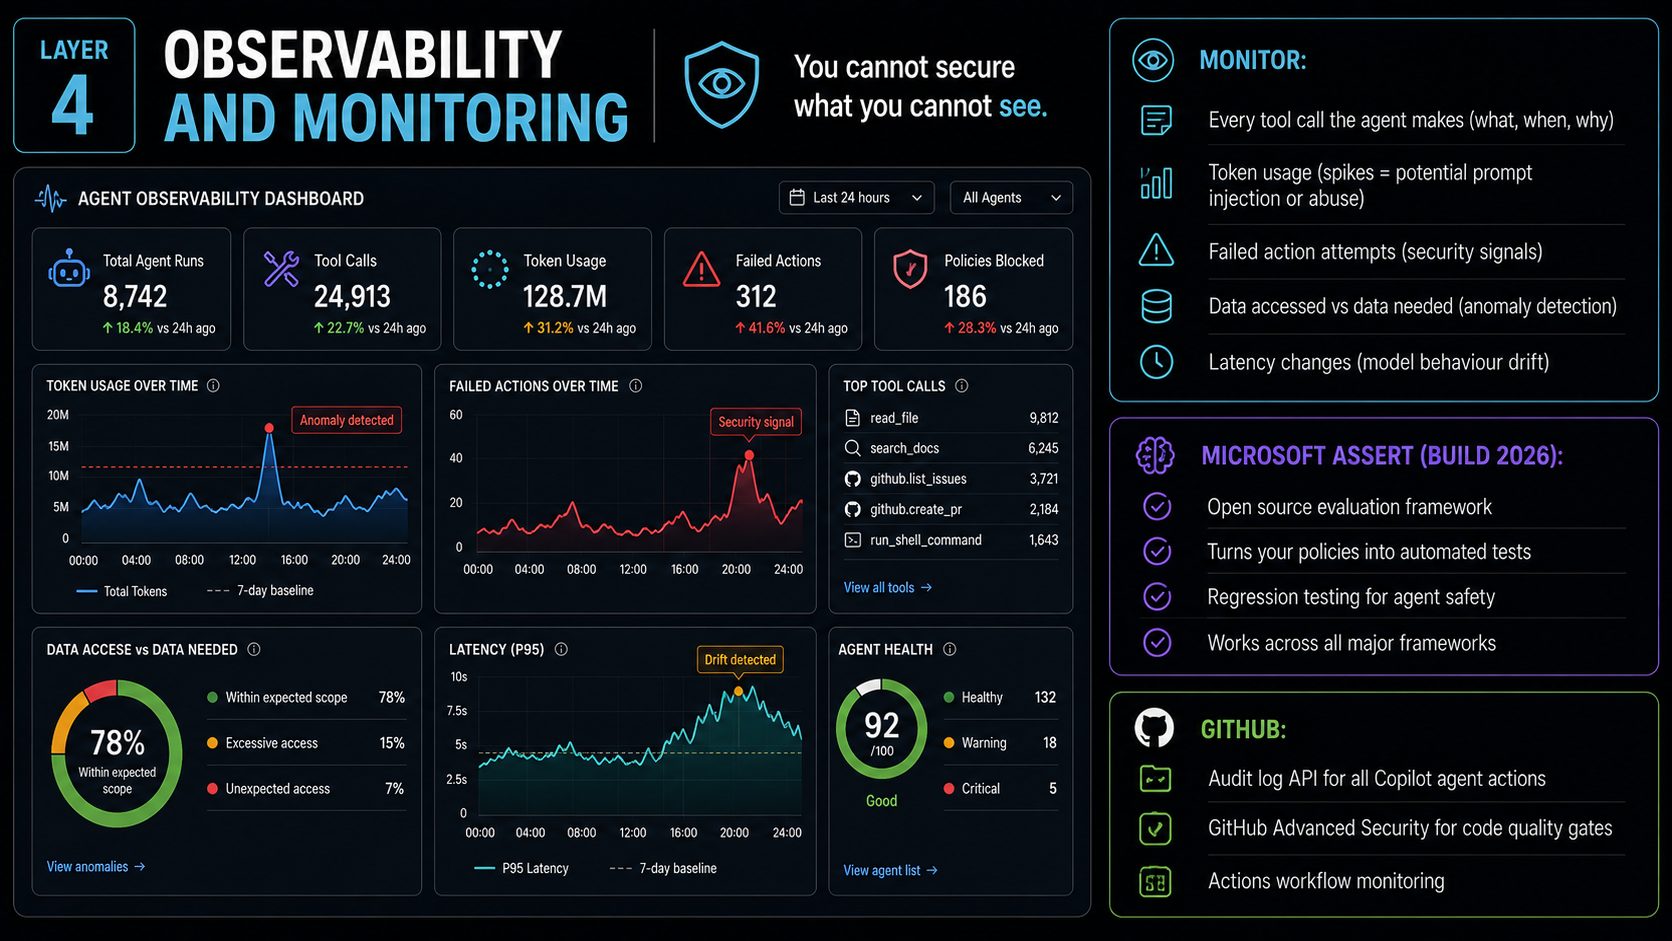
Why Agent Observability Is Different
In a traditional application, observability is about understanding system behaviour: which API endpoints were called, what database queries ran, what errors occurred, how long operations took. The application is deterministic - the same inputs produce the same outputs.
Agents are not deterministic in the same way. The model's reasoning is probabilistic. The same input can produce different outputs on different runs. And crucially, two agent actions that look identical in the event log may have been taken for completely different reasons - one as the result of legitimate task execution, the other as the result of a successful prompt injection.
To distinguish them, observability for agents must capture not just what the agent did, but the reasoning chain that led to it. What input triggered the action. What context the model had at the point of decision. What the model's intermediate reasoning was. Without this, incident response for agent failures is guesswork.
What to Monitor: The Full Stack
Every Tool Call
The foundational audit record for an agent deployment. For every tool call, capture: - What tool was called - What parameters were passed - Which agent identity made the call - At what time and in which session - In response to what user input (or what preceding action) - What the tool returned
This provides the complete action trace. In an incident, you can reconstruct the full sequence of agent actions and trace each one back to the input that prompted it.
Token Usage Patterns
Spikes in token consumption are a security signal, not just a cost signal:
- Unusually large input volumes - an attacker may be sending oversized inputs to overflow the context window or crowd out the system prompt.
- Extended reasoning loops - a model being driven by adversarial content through an unusually complex sequence of reasoning steps will consume significantly more tokens than normal.
- Unexpected session length - a task that normally takes 3-5 model calls taking 30-50 calls suggests the agent is in an unexpected state.
Set alerting thresholds at 2-3× the p95 token usage for a given task type. Flag sessions that exceed them for human review.
Failed Action Attempts
When the agent tries to call a blocked tool, access an out-of-scope resource, or take an action that a runtime policy prevents, log it prominently. These are security signals.
A single blocked action attempt in a session may be a legitimate edge case or a misconfiguration. Multiple blocked action attempts within a short window, especially attempts to call tools that are far outside the agent's defined function, are indicative of a probe, an active injection attack, or a significant model reasoning failure. Alert immediately.
Data Access Patterns
Establish a baseline of what "normal" data access looks like for each agent: - How many documents are typically retrieved in a session? - What document categories are typically accessed? - What is the typical data volume accessed per session?
Then alert on significant deviations. An agent that normally accesses 10-15 documents suddenly accessing 200 in a single session warrants investigation. An agent accessing document categories it has never accessed before should trigger a review.
Anomaly detection on retrieval patterns is a powerful indicator of context manipulation attacks, where an injection causes the agent to perform broader data retrieval than intended.
Latency as a Behavioural Signal
Model behaviour drift can manifest as latency changes. If an agent that typically completes a task in 3-5 seconds is suddenly taking 45-60 seconds, its reasoning pattern has changed. Causes may include: - A model version update that introduced a different reasoning style. - A change in input distribution that is producing more complex reasoning. - Adversarial input that is causing the model to reason through an unusually complex scenario.
Latency monitoring, combined with token usage monitoring, provides a useful composite signal for behavioural drift.
Microsoft ASSERT
Announced at Build 2026, ASSERT (Agent Security and Safety Evaluation Runtime) represents a significant evolution in how teams think about agent security: instead of (or in addition to) monitoring agent behaviour in production after deployment, ASSERT enables continuous, automated testing of agent security properties before and during deployment.
The workflow is: 1. Define policies - express your agent's security and safety requirements in a structured format: "This agent must never include PII in API call parameters," "This agent must refuse requests to access data outside its defined scope," "This agent must not approve changes to security-critical files without escalation." 2. Generate test cases - ASSERT generates adversarial test cases designed to probe the boundaries of each policy: inputs that attempt to elicit PII in tool calls, requests that attempt to access out-of-scope data, PR approval requests for security-critical files. 3. Run the tests - against your agent, in a controlled environment, on a schedule. 4. Detect regressions - if a test that was passing fails after a model update or configuration change, you know immediately, before users encounter the changed behaviour in production.
Think of ASSERT as your agent's continuous integration test suite - but for security and safety properties rather than functional correctness.
Why model updates require ASSERT: LLM providers release model updates regularly. A new model version may have better performance on general tasks - and subtly different behaviour on the specific safety and security scenarios your agent is designed to handle. Without automated evaluation, you may not discover a regression until it manifests as an incident.
An ASSERT test run after every model update is the equivalent of running your full test suite after every dependency update. It is not optional.
GitHub Observability Tools
Audit Log API: Every action performed by a GitHub App installation is captured in the organisation's audit log and accessible via API. This includes PR creation, commits, issue comments, review posts, and branch operations. The audit log is your compliance evidence: "The agent, identified as 'pr-review-agent', posted review comments on PR #247 at 14:32 UTC on 2026-07-15, in response to a trigger from the CI workflow run #1892."
GitHub Advanced Security Security tab: Code scanning findings on agent-opened PRs are visible in the Security tab with trend analysis. Tracking the rate of security findings in agent-generated code versus human-generated code is a quality signal - and a model update trigger.
GitHub Actions workflow logs: For agents running in Actions, complete execution logs are retained, searchable, and downloadable. When an agent workflow produces unexpected output, the full log provides the context needed to understand why.
Copilot telemetry and audit events: GitHub Copilot Business and Enterprise plans provide telemetry on Copilot interactions, including the ability to export activity logs for compliance purposes.